Registration & revenue analytics
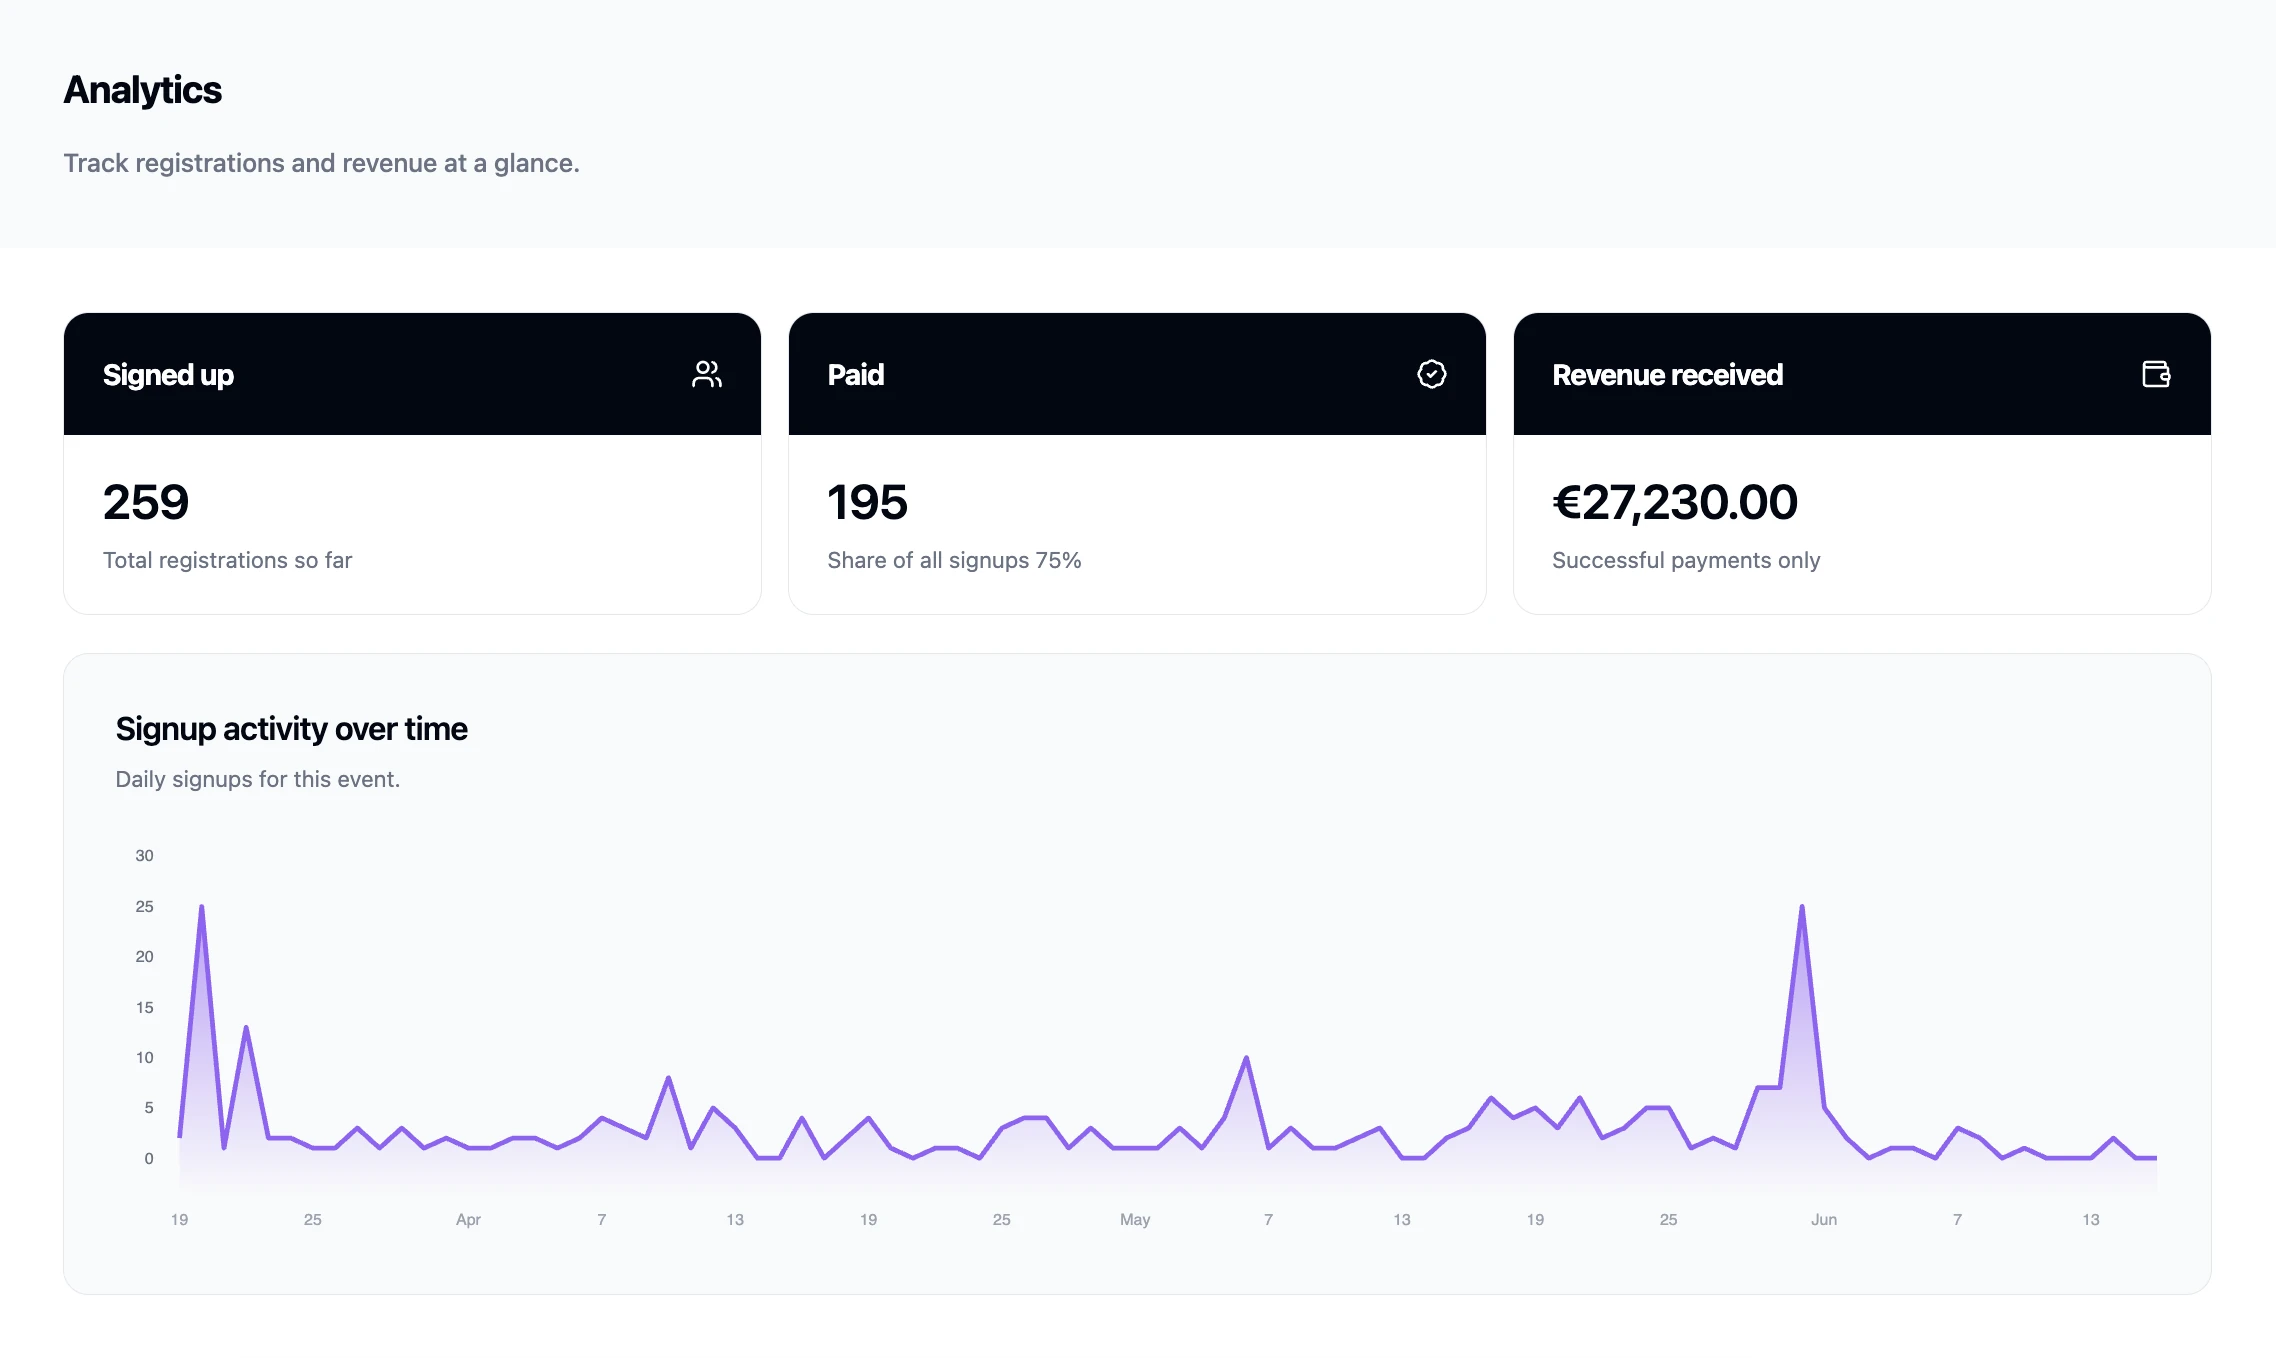
Your event's Insights page gives you the headline numbers for how your event is performing. The Overview shows a quick snapshot of the same figures, with a View insights link through to the full charts.
What you'll see
- Sign-ups — total registrations, plus a sign-ups over time chart showing how they build day by day.
- Paid — how many people have completed payment and their share of all sign-ups, with a payments over time chart on the same timeline as sign-ups — so you can read the lag between registering and paying at a glance.
- Revenue — how much you've taken from successful payments, in your event's currency.
Using it
These figures update as people register and pay, giving you a live read on momentum — handy for deciding when to push promotion or close registration.
Going deeper
- For the underlying list and per-person detail, see Managing your participant list.
- For specific questions ("how many of each ticket type?", "average age?"), ask the AI assistant.
- For how people are finding your page, see Web analytics.
Was this helpful?